Why are Large caps better positioned today compared to SMIDs?
- M Manohar Rao
- Jan 17, 2025
- 5 min read

Tags: Wealth Management, Investment Lesson, Mutual Funds, Stock market, Budget, Finance, Investing, Personal Finance, Investment
"I will tell you how to become rich. Close the doors. Be fearful when others are greedy. Be greedy when others are fearful." — Warren Buffett
In the world of investing, various investment strategies could play a role in shaping the desired portfolios – winning formula. While diversification across the asset class is helpful in navigating dynamic sphere of investment, optimal exposure across Large, Mid and Small caps is an essential part of balancing risk-reward of the portfolio within the realm of equity investing.
Over the last 1-year, investors have been significantly rewarded by the rally in Small and Mid caps (SMIDs). The SMIDs space has given almost double the returns of Large caps leaving investors with high-expectations of the same to continue going ahead. This has also led to huge divergence between the share of market caps.
The proportion of Large caps in Nifty 500 Index, which was almost close to the peak in 2020 at 79%, is now below decade levels at 70%. This indicates that Mid and Small caps have become relatively expensive while Large caps have turned undervalued after four years of significant market up move. This could also mean that Large caps may outperform the Mid and Small cap peers in the future as mean-reversion plays out.

The other way to slice the data is the five-year rolling returns data for Large, Mid and Small cap indices. Here again, there is a widening gap between the Large caps vis-a-vis Mid and Small caps. The data is similar even if we consider three-year rolling returns, this is led by a remarkable performance turnaround by the Mid and Small caps, particularly from the COVID-19 market bottom out. Considering the widening gap, it could narrow in the time ahead as we see the mean reversion phenomenon playing out eventually across the market cap buckets.
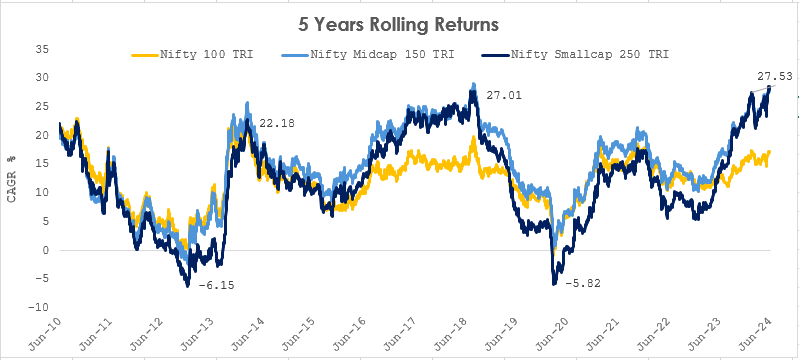
If we take the rolling five-year returns data for Large, Mid and Small caps, we see that Large caps have slightly lower returns than Small and Mid caps and with a 4% gap. However, when adjusting for volatility using the Sharpe Ratio, it is clear that the risk-adjusted returns in Large and Mid caps are not too different. In fact, the risk adjusted returns are significantly inferior in Small caps.
To put it simply, Small caps could bring in more volatility but may not commensurate excess returns over Large caps. Mid caps, however, provide excess returns for the extra volatility they bring to the investor portfolio.

Rolling Returns with daily frequency of the indices for 15 years (June 30, 2009 to June 30, 2024). Different plans have different expense structures. The performance details provided herein are of the regular plan. Past performance may or may not be sustained in the future.
CAGR – Compounded Annual Growth Rate
Another key thing to note is that many frontline sectors in India have seen consolidation in the last 15 years. While it is not necessary that all sector leaders are Large caps, a majority of them are from the Large cap category. Hence, when we look for companies growing faster than the sector and gaining market share in the medium to long term (5-10 years) tend to be higher in Large caps.

* Incremental share = change in aggregate company numbers divided by change in industry numbers between FY23 v/s FY17
^ Corresponds to FY22 numbers and corresponding incremental share computed between FY17 – FY22
The consolidation theme has been played out by Merger & Acquisition (M&A) activities, wherein stressed smaller players have been acquired by larger players with stronger balance sheets. In the table below, we can see this playing out in the Cement and Steel sectors where multiple M&As have happened.
Merger & Acquisition in Cement Sector

Merger & Acquisition in Steel Sector

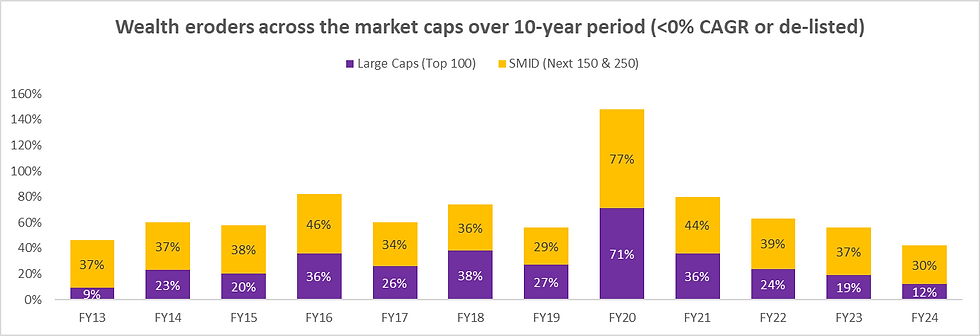
Since our investment horizon tends to be at least 5-10 years and market long-term returns have been around 15%, we tried to use this rate of return to identify the number of companies in each of the market cap that have crossed this threshold in a 10-year timeframe. While there are higher numbers of Mid & Small caps presumably, Large caps are not far behind in the absolute number of companies clearing the hurdle rate. The point is that even Large caps have the potential to grow faster and create wealth for investors on a medium to long-term basis.

Conversely, if we look at companies that have given negative returns on 10 years basis or stopped trading (due to delisting, M&A activities etc.), there again Large caps provide better safety than Small and Mid caps.
Finally, when we look at historical valuations, on a trailing P/B basis, Small and Mid caps are clearly in the expensive zone while Large caps are relatively better. Furthermore, a comparison between Large and Mid caps too indicating a preference for Large over Mid caps for the last few quarters.

While Mid and Small cap earnings have grown strongly in the last four years and that has reflected in the category outperformance, when we dive deeper, we see that the topline growth of all three market capitalisations is not very different.
When we look at a five-year CAGR (to avoid COVID base impact), the revenue CAGR broadly is around the ~10% mark. This shows that the profitability of Mid and Small caps has improved significantly in the last few years, helping in the profit growth and eventually in the multiple growth. The revenue growth gap would be far more sustainable than the margin-led profit growth gap. Hence, we need to be watchful of the ability of Mid and Small cap companies to grow faster than their larger peers, as margin improvement can only go a limited distance.

To summarise, on account of the valuation differential Large caps look attractive over Small and Mid caps at an aggregate level. While Large caps may be better than Mid and Mid caps may be better than Small caps, within each of these pockets there could be companies looking reasonably attractive due to their promising growth and suppressed valuations compared to the growth potential. Also, due to their higher volatility, Small and Mid caps may require higher investor risk appetite and even longer holding periods as compared to Large caps.
While each asset class, sector and market cap category goes through its cycle and there may be a better opportune time for Mid and Small caps, however, now is the time to say “Bada hain to behtar hain!” meaning “Bigger the better!”
Disclaimer:
The information set out above is included for general information purposes only and is not exhaustive and does not constitute legal or tax advice. All complaints regarding Mutual Fund can be directed towards visit www.scores.gov.in (SEBI SCORES portal). Readers are requested to make informed investment decisions and consult Chaitanya Financial Consultants – 9000628943 / mfd.mmr@gmail.com to determine the financial implications with respect to investing in Mutual Funds.
Mutual Fund Investments are subject to market risks, read all scheme related documents carefully.


Comments