Short-term pain, but with long-term opportunity
- M Manohar Rao
- Jan 9, 2025
- 5 min read

Tags: Wealth Management, Investment Lesson, Mutual Funds, Stock market, Budget, Finance, Investing, Personal Finance, Investment
Wealth creation through investing in the equity market often tests the investors’ patience as markets go through cycles of upswings and downturns. These cycles get even more challenging when certain segments of the market perform significantly well while others remain stagnant or even go through phases of correction.
Several investors, especially those overly focused on short-term returns, get perturbed by these swings. Influenced by the sentiments prevailing in the market, they often make mistakes and ultimately have to compromise on long-term wealth generation. As such, it is of utmost importance for investors to understand their own investment horizon, return expectations and ability to take risks, and then select funds best suited for them based on the underlying investment philosophy and nature of the portfolio.
We can attempt to understand this phenomenon by looking at the two most widely followed investment styles in the market: Quality and Value. These have delivered highly divergent returns over the last couple of years, highlighting the style rotation that may play out during various phases of the market cycle. Gaining an understanding of this style rotation pattern can help disciplined investors align their investments with their long-term return expectations and avoid the mistake of churning their investment portfolio frequently by trying to lap up the hottest investment style prevailing now.
Style Rotation: Quality versus Value

In the above graph, we have used Nifty 200 Quality 30 TRI and Nifty 500 Value 50 TRI to represent Quality and Value styles respectively.
The chart depicts the various phases of outperformance by one style over the other by using the difference in one-year returns of respective styles at any given point in time over the last 15 years. Periods, when the shaded portion is in positive territory, represent outperformance by Quality over Value, while the negative periods depict Value’s outperformance. It is visible from the above chart that both styles of investing have favourable periods during which they deliver significant outperformance, followed by periods of equally sharp underperformance, and these phases have lasted for anywhere between one to four years.
In the current phase, Value style’s outperformance started in early 2021 and continues till date, marking the longest phase of outperformance seen in the past 15 years.
Such phases of style rotation can at times influence investors in believing that opportunities to shift frequently from one style to another exist and substantial returns can be generated from timing the market. However, often these opportunities become apparent only in hindsight and it is extremely rare to be able to accurately time such switches with any sort of consistency. Investors can end up making these switches during a late stage in the cycle when most of the outperformance has played out and potential future returns are minimal, even negative at times. Alternatively, by following the discipline of staying invested in their preferred style, even during periods of underperformance, investors can avoid such mistakes and reap the benefits when the tide turns in their favour.
History shows that while there will always be divergence in performance in the near term, returns tend to converge over sufficiently long periods and staying disciplined in the investment approach is the key to maximising the return potential.
The table below highlights the convergence in long-term returns of both styles:

Valuations: Comfort Emerging in Quality-Growth Style
Even if an investor understands the benefits of staying disciplined, it may be extremely difficult to practice that during periods of sharp underperformance. One key metric that can help the investor stay focused is the valuation of the underlying portfolio, which can provide insights into possible turnaround in performance.
Let us take the example of the UTI Flexi Cap Fund, which follows a focused and disciplined approach of investing in businesses with high quality as demonstrated by their ability of generating high Return on Capital Employed (RoCE) and consistent cash flows and which is expected to show secular long-term growth and is not cyclical.
The following graph depicts the premium in valuation of the UTI Flexi Cap Fund’s portfolio over valuation of the Nifty 500 TRI index for the past 10 years.
Given the quality and growth orientation of the fund, the valuation of the portfolio has always been at a premium to the index, and the average premium over the last decade has been 53%. However, there have been periods when the premium has deviated significantly from the average. The current period is one such phase, as the valuation premium has declined to 32%, which is significantly below the average and near the lowest valuation points witnessed in the past.
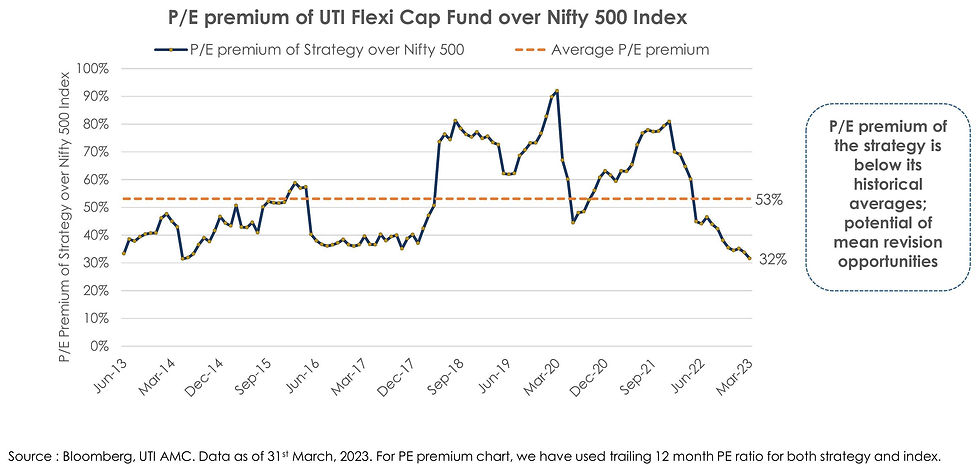
While it is always difficult to identify the exact point of turnaround, the above data suggest that pessimism for the quality-growth strategy has reached an extreme, raising the probability of a turnaround going ahead. By remaining focused on the quality-growth investment philosophy, the UTI Flexi Cap Fund is maximising the chance of benefiting when the tide turns in favour of a quality-growth style. Even for investors in the fund, this phase provides an opportunity to benefit from the turnaround by remaining invested and, ifpossible, allocating incremental capital at a favourable point.
Portfolio Commentary of UTI Flexi Cap Fund:
The investment philosophy followed by the UTI Flexi Cap Fund is to identify high-quality companies that have demonstrated the capability to generate superior returns on capital and free cash flow, thereby consistently enabling them to generate long-term economic value across business cycles.
In addition, the focus is on selecting companies that have delivered industry-leading growth and that continue to have the potential to compound earnings at an above-average pace for the next five to seven years. These are typically companies that are leaders in their respective segments or have the potential to gain market share in a high-growth industry.
The table below presents a snapshot of the portfolio’s quality and growth orientation as compared to the S&P BSE 100 index:

While there has been a sharp underperformance over the past few months, the UTI Flexi Cap Fund will continue to hold on to the portfolio companies where conviction in the resilience of quality and growth of business remains intact. The Fund may even increase exposure to portfolio companies whose valuations have become attractive.
Key Takeaways:
There can be divergence in performance between Quality and Value styles in the short to medium term, however, returns tend to converge in the long term.
In the current phase, the Value style has outperformed Quality-based portfolios as well as broader markets (Nifty 500 TRI).
The valuation premium of the strategy (UTI Flexi Cap Fund) is below its historical averages, indicating the potential to outperform as and when the tide turns.
The portfolio of the UTI Flexi Cap Fund continues to hold companies with low leverage, industry leadership position and the ability to gain market share during periods of stress. These typically are companies that generate consistent free cash flow and high return on capital across business cycles.
The current phase of underperformance in the UTI Flexi Cap Fund may be seen as an opportunity to benefit from the turnaround by remaining invested and, if possible, allocating incremental capital at a favourable point.
Let us conclude with two relevant and profound quotes by two of the most experienced investors:
“The stock market is designed to transfer money from the active to the patient.”— Warren Buffet
“Great investing requires a lot of delayed gratification.”— Charlie Munger
Disclaimer:
The information set out above is included for general information purposes only and is not exhaustive and does not constitute legal or tax advice. All complaints regarding Mutual Fund can be directed towards visit www.scores.gov.in (SEBI SCORES portal). Readers are requested to make informed investment decisions and consult Chaitanya Financial Consultants – 9000628943 / mfd.mmr@gmail.com to determine the financial implications with respect to investing in Mutual Funds.
Mutual Fund investments are subject to market risks, read all scheme related documents carefully.


Comments